Collect data using ADC
In this experiment, analog value will be collected by ADC and will be sent to Jetson Orin Nano using Serial Communication.
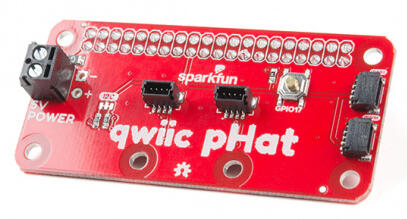
Qwiic pHAT
The Jetson Orin Nano is equipped with Qwiic pHAT, which allows to connect the $I^{2}C$ bus (GND, 3.3V, SDA, and SCL) on your Jetson or Raspberry Pi to an array of Qwiic connectors.
The Qwiic pHAT V2.0 has four Qwiic connect ports, all on the same I2C bus. It also has a simple 5V screw terminal to power boards that may need more than 3.3V and a general-purpose button. This HAT is compatible with NVIDIA Jetson Orin Nano as well as any Raspberry Pi that utilizes the standard 2x20 GPIO header.
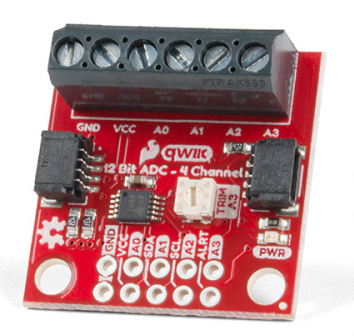
Qwiic 12-Bit ADC
An analog to digital converter (ADC) is very useful tool for converting an analog voltage to a digital signal that can be read by a microcontroller. The ability to converting from analog to digital interfaces allows users to use electronics to interface and interact with the physical world.
The SparkFun Qwiic (12-bit) ADC provides four channels of I2C controlled ADC input to your Qwiic enabled project. These four channels can be used as single-ended inputs, or in pairs for differential inputs. The ADS1015 uses its own internal voltage reference for measurements, but the ground and 3.3V power are also available on the pin outs for users.
Two wire serial protocol ($I^{2}C$)
I2C is a two-wire protocol for communicating between devices. At the physical level it consists of 2 wires: SCL and SDA, the clock and data lines respectively.
First run the following code to import the necessary modules and initialize the I2C bus. ADS1x15 is a python library for I2C ADC ADS1015, ADS1115, and similar analog to digital converter. This library works with Raspberry pi or Jetson using I2C bus under Linux kernel.
import time
import ADS1x15

print("ADS1X15_LIB_VERSION: {}".format(ADS1x15.__version__))
now we can actually create the ADC object. First, initialize ADS1015 on I2C bus 7 with default address 0x48. Note that $I^{2}C$ bus is connected to bus 7 in Jetson Orin Nano
ADS = ADS1x15.ADS1015(7)
Set the gain value, indicating the maxVoltage that can be measured. Adjusting the gain allowing to make more precise measurements.Available options: PGA_6_144V, PGA_4_096V, PGA_2_048V, PGA_1_024V,PGA_0_512V, PGA_0_256V
# set gain to 4.096V max
ADS.setGain(ADS.PGA_4_096V)
Single Ended Mode
Reading the ADC in single mode is very straightforward, the readADC() function handles all in one call. This function will wait until conversion finished. For example, The module has an onboard 10K trimpot connected to channel A3. This is handy for initial setup testing and can be used as a simple variable input for testing so we will read ADC in pin 3
pin = 3

val = ADS.readADC(pin)
volt = ADS.toVoltage(val)
Now you can read the raw value and voltage of the channel using either the the value or convert to voltage.
print(val, volt)
Task 1: Connect variable resistor to ADC
Connet $10\ \mathsf{k\Omega}$ Variable resitor by connecting the middle terminal to A0 and the two end terminals to Vcc and GND. Read the volt at pin 0
pin = 0

val_0 = ADS.readADC(pin)
volt_0 = ADS.toVoltage(val_0)

print(val_0, volt_0)
Task 2: Measurement of ADC and Voltage Range
Rotate the variable resistor through its full range of motion. Record the minimum and maximum ADC readings and their corresponding voltage values.
| Minimum | Maximum | |
|---|---|---|
| ADC Value | ||
| Voltage (V) |
Note that the ADC does not reach its maximum value because the maximum voltage across the variable resistor does not reach the configured full-scale gain value of 4.096 V. In general, the input voltage can be calculated using the following equation: $$ v = \frac{\text{adc\_value}}{2048} \times \text{full-scale gain} $$
Differential Mode
Read differential ADC between pin 0 and 3
val_03 = ADS.readADC_Differential_0_3()
volts_03 = ADS.toVoltage(val_03)

print(val_03, volts_03)
Visualization utilities
Execute the cell below to enable live plotting.
from bokeh.io import push_notebook, show, output_notebook
from bokeh.layouts import row
from bokeh.plotting import figure
from bokeh.models import ColumnDataSource
from bokeh.models.tickers import SingleIntervalTicker

def figure_setup():
    output_notebook()

    colors = ['#1f77b4', '#ff7f0e', '#2ca02c', '#d62728']

    p1 = figure(title="Voltage (V)", x_axis_label="time", height=300, width=360)
    source1 = ColumnDataSource(data={'time': [], 'Volt': [] })

    r1 = p1.line(x='time', y='Volt', line_width=2, color=colors[0], alpha=0.8, legend_label="Voltage", source=source1)

    p1.legend.location = "top_right"
    p1.legend.click_policy="hide"

    return p1, source1
Continuous Voltage Acquisition and Real-Time Plotting
The following code continuously reads voltage data from the ADS1015 ADC and displays it in real time using a live plot.
pin = 0

data = [['time (s)', 'Voltage (V)']]
start = time.time()

p1, source1 = figure_setup()

handle = show(row(p1), notebook_handle=True)

ADS.setMode(ADS.MODE_CONTINUOUS)

while True:
    try:
        time.sleep(.01)

        sample_time = time.time()-start
        val = ADS.readADC(pin)
        volt = float(ADS.toVoltage(val))

        data.append([sample_time, volt])
        new_data1 = {'time': [sample_time],
                     'Volt': [volt] }

        source1.stream(new_data1)

        push_notebook(handle=handle)

    except KeyboardInterrupt:
        break
Saving the Recorded Data to a CSV File
The following code saves the collected time and voltage measurements into a CSV file for later analysis.
import csv

file_name = 'my_data.csv'

with open(file_name, 'w', newline='') as file:
    writer = csv.writer(file)
    writer.writerows(data)